Alexia Gómez & col.
622
The fatty acid composition of heart mitochondria lipids and derived indexes
were also measured (Table 4). The fatty acids 18:0, 20:4n-‐6, 22:0, 22:4n-‐6, 22:5n-‐
6, 22:5n-‐3, 22:6n-‐3 and 24:0 were significantly lower and the fatty acid 18:2n-‐6
was significantly higher in the atenolol group. Due to these changes the acyl chain
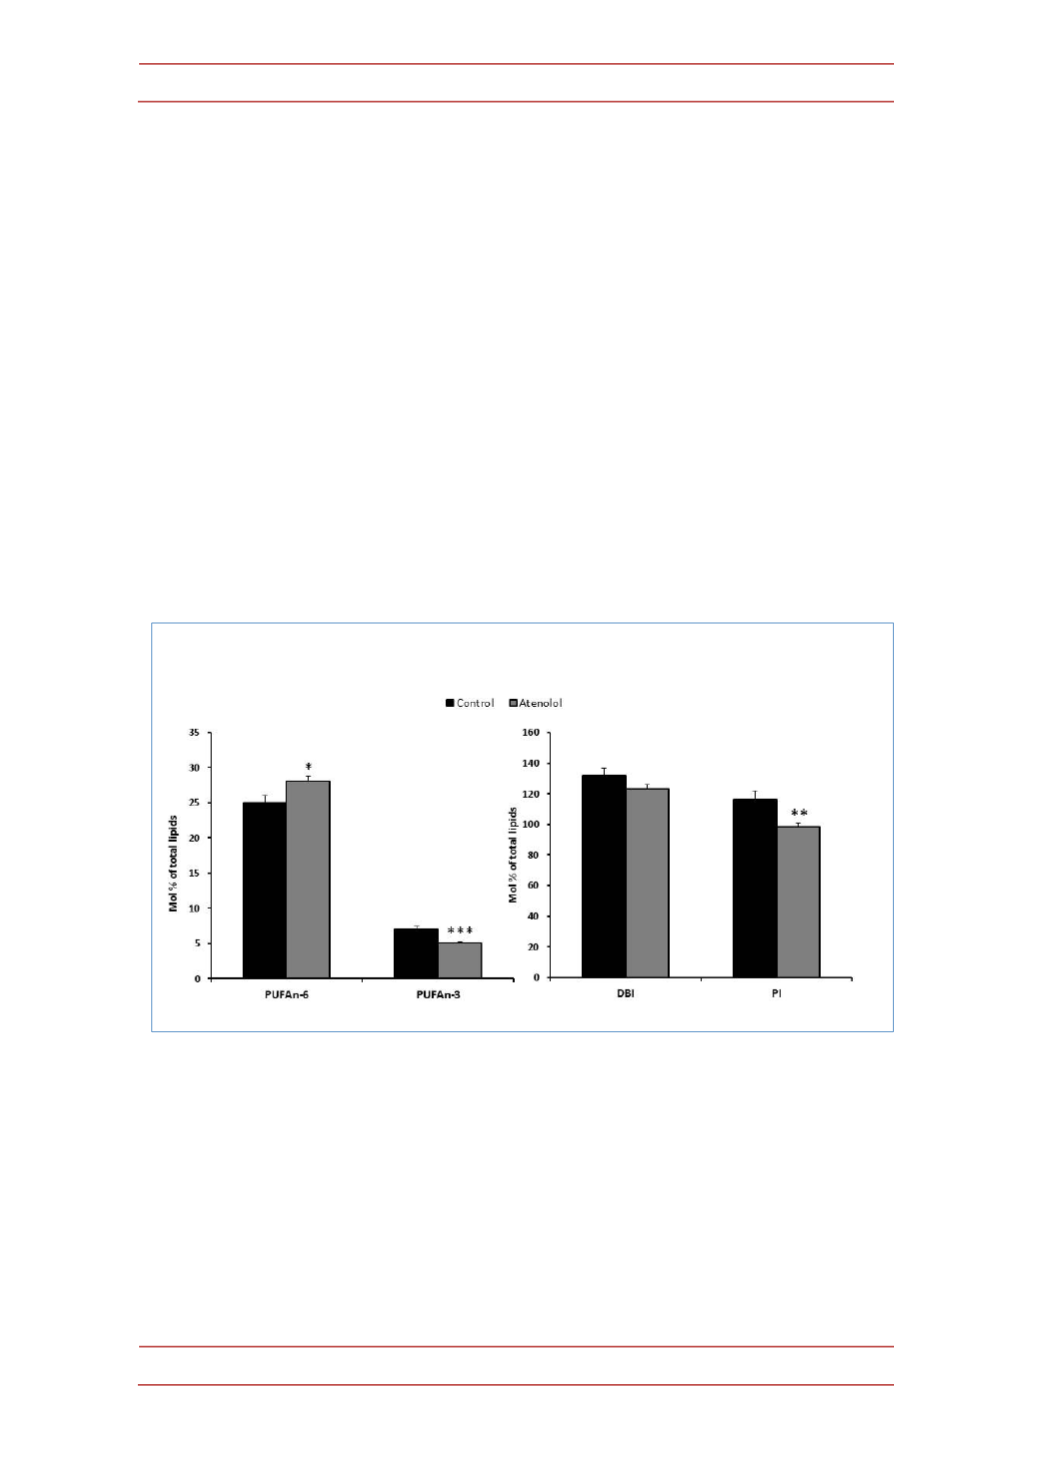
length decreased (ACL; 0.66% total decrease), the PUFAn-‐3 strongly decreased
(27.61% total decrease) and the PUFAn-‐6 increased (12.31 % total increase). The
final result was a strong decrease in the peroxidizability index (PI; 15.20% total
decrease) and a non-‐significant trend to decrease the total number of double
bonds (6.94% total decrease in the double bond index, DBI) in the atenolol group
in relation to the control group (P<0.01 in PI; Figure 3).
The estimation of the desaturase and elongase activities is shown in Tables
5 and 6. The desaturase activity Δ9 (n-‐9) was higher, while Δ5 (n-‐6) was lower in
the atenolol group. Integrated n-‐6 and n-‐3 desaturation and elongation activities
were also lower in the atenolol group. The elongase activities ELOVL 1/3, ELOVL 5
(n-‐6), ELOVL 2/5 (n-‐6) and ELOVL 2/5 (n-‐3) were significantly lower in the
atenolol group.
Figure 3.-‐ PI and DBI (fatty acid unsaturation degree) and total PUFAn-‐6 and PUFAn-‐3 of
heart mitochondria from control and atenolol treated Wistar rats.
PUFA= polyunsaturated
fatty acid; DBI=double bond index; PI= Peroxidizability index. Abbreviations and calculations of
fatty acid classes and indexes are explained in the Materials and Methods section. Control values:
116.22±5.49 (PI); 131.93±4.70 (DBI); and 7.10±0.39 (for PUFAn-‐3) and 25.01±0.97 (for PUFAn-‐6),
both expressed as mol %. Values are means ± SEM from 8 different samples per group. Asterisks
represent significant differences compared to the control group: * P<0.05; ** P<0.01; ***P<0.001.


